

Chapter 9: The Price Puzzle: What Drives the Market
Why are mangoes costly in May and cheap in July — and why does the same flight seat change price overnight?
Original notes — ready CBSE (NCERT, English Medium) • Class 9 • Social Science • Book: Understanding Society: India and Beyond — Part 1
Chapter 9: The Price Puzzle: What Drives the Market — EG's own notes, in simple words
Book: Understanding Society: India and Beyond — Part 1 (CBSE, Class 9) | Chapter 9 | Medium: English
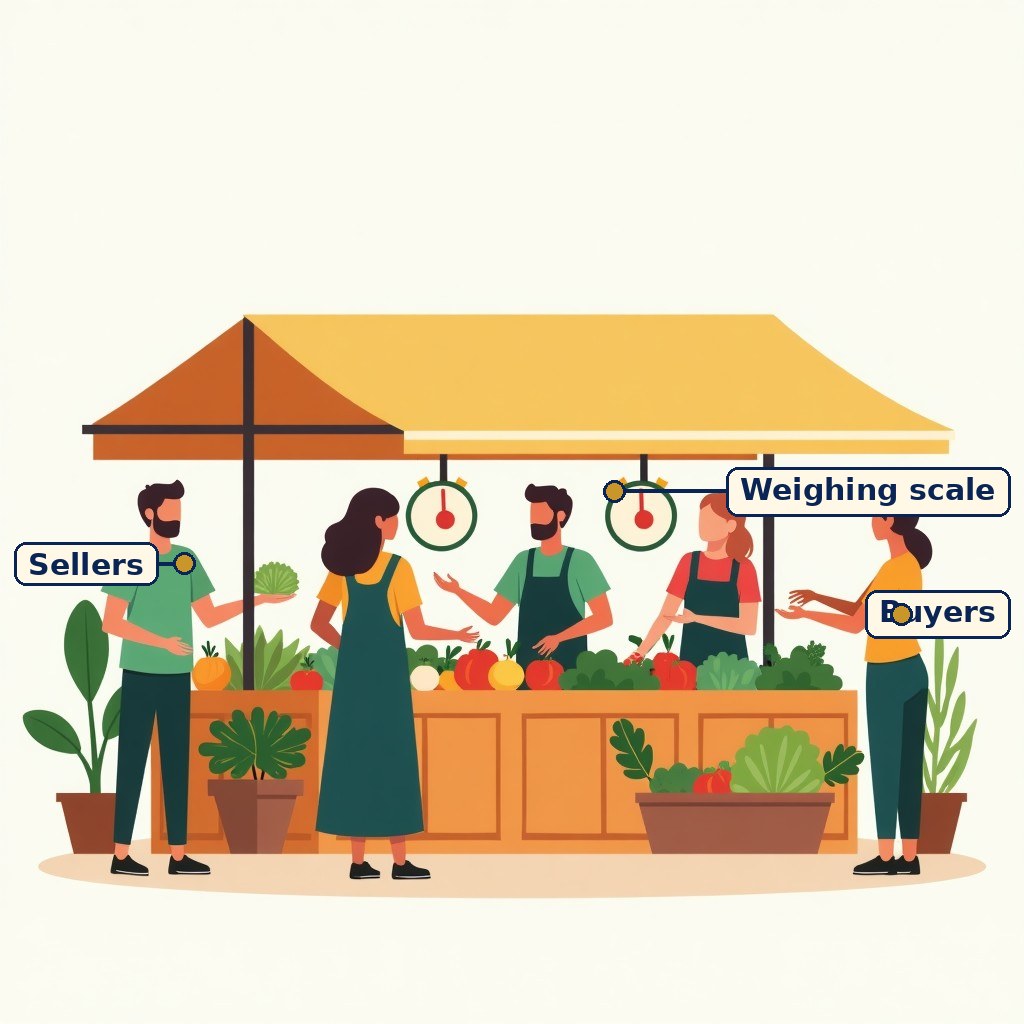
Diagram (labels are printed on the image): Sellers, buyers and a weighing scale at a market stall. A general picture of a market, not a scene from the book.

A vegetable seller weighing produce for a customer. A general picture of price in daily life, not a book scene.
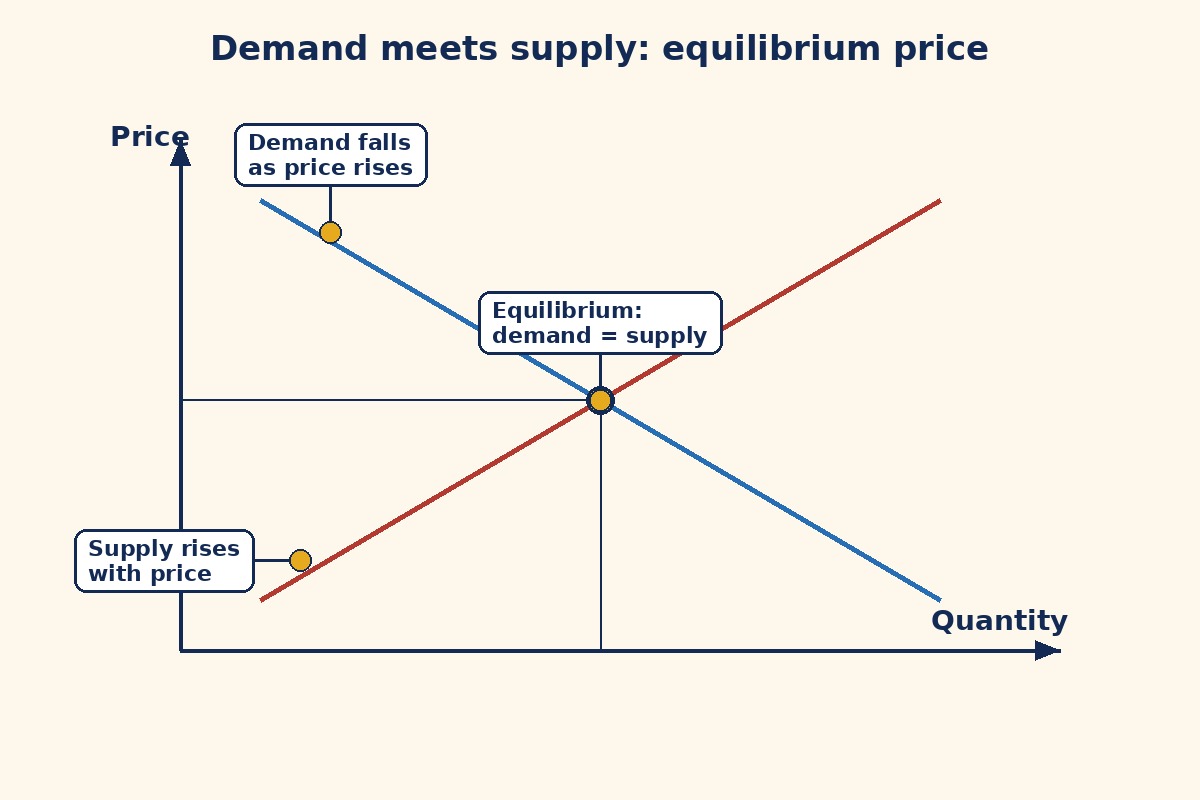
New diagram (labels are printed on the image): The demand curve slopes down (quantity demanded falls as price rises) and the supply curve slopes up (quantity supplied rises with price). Gold dots sit on each curve and on their crossing — the equilibrium, where demand equals supply.
What the chapter is about
Prices do not change randomly. Mangoes cost more at the start of the season and less later; vegetables are dearer in the morning than in the evening; onion prices swing every few months; the same flight seat costs ₹3,000 one day and ₹9,000 another; shops announce discounts at certain times of year. Behind all of it are two forces — demand (what buyers want and can pay for) and supply (what sellers offer) — and their interaction, which sets prices, creates shortages and surpluses, and keeps moving, so equilibrium is never fixed. Markets also do not always work fairly, which is why governments intervene with price controls, regulation, public goods and action against hoarding and black-marketing.
Demand: the law, the schedule, the curve
Demand is the quantity of a product that people are willing and able to buy at a particular price — desire alone is not demand; purchasing power must back it. The law of demand states the inverse relationship: when price rises, quantity demanded falls, and when price falls, quantity demanded rises, other things being equal. The chapter's mango example makes it concrete: at ₹150 per kg, Srivalli buys 1 kg; at ₹100, she buys 2 kg; at ₹50, she buys 3 kg. That list of prices and quantities is the individual demand schedule; plotted on a graph, it becomes the downward-sloping demand curve. Adding up all buyers gives market demand. But demand also shifts when things other than price change: income rises (people buy more, or switch to higher-quality products); tastes, trends and seasons change (sweaters in winter, mangoes in summer); prices of related goods change (if a substitute becomes dearer, demand for this good rises); and expectations change (if buyers expect prices to rise, they buy now). A price change moves along the curve; a change in income, tastes, substitutes or expectations shifts the whole curve.
Supply: the law, the schedule, the curve
Supply is the quantity sellers are willing and able to offer at a particular price. The law of supply states the direct relationship: higher prices encourage sellers to supply more, lower prices lead them to supply less — hence the upward-sloping supply curve, drawn from the supply schedule of prices and quantities. Like demand, supply shifts with other factors: input costs (if inputs become dearer, supply falls); technology (better methods raise supply); weather and natural conditions (good weather raises crop supply); taxes and subsidies; the profitability of other goods (if potato becomes more profitable, farmers shift from another crop to potato); and expectations (if sellers expect higher prices soon, they may hold back supply now to sell later). Individual supply is one seller's offering; market supply is the total of all sellers.
Equilibrium — and why it never stands still
Market equilibrium occurs where quantity demanded equals quantity supplied: the equilibrium price clears the market, with neither shortage (excess demand) nor surplus (excess supply). The chapter's worked example puts equilibrium at a price of ₹100 and a quantity of 12 kg. If the price is set above equilibrium, supply exceeds demand — a surplus pushes prices down. If it is set below, demand exceeds supply — a shortage pushes prices up. In theory, equilibrium is a single crossing point of the two curves. In the real world, it is never stable: technology, wages, interest rates, wars, political events, pandemics, weather and natural disasters constantly shift demand and supply, so the market is always adjusting towards a new equilibrium, never settling. The COVID-19 mask example proves it: in 2020, mask demand surged, supply could not catch up, prices rose sharply; over time suppliers adjusted and prices fell; after the pandemic, demand fell further and prices returned to pre-pandemic levels. Dynamic pricing shows the same logic daily: a Goa hotel with 100 rooms charges ₹1,500 on an off-season weekday (Monday in July), ₹8,000 on a tourist-season Saturday in December, and ₹25,000 on New Year's Eve — and may cut tariffs 40% overnight if a group booking cancels — because room demand changes with season, events, nearby hotels' tariffs, weather and booking pace.
Why governments intervene
India is today the world's fourth-largest economy and a market-based, regulated economy in which prices depend on demand and supply. But markets allocate goods by willingness and ability to pay — so if essential medicines become very expensive, will they reach everyone? Fairness and equity, especially for vulnerable and low-income groups, require intervention. The government therefore: regulates unfair practices — setting maximum prices (price ceilings) for essential goods like medicines to prevent overcharging, and minimum wages (price floors, which must sit above equilibrium to be effective) so workers earn enough; and controlling monopolies, where a single seller controlling a unique product with no close substitutes could charge more, supply less and offer poorer quality. Regulators keep markets transparent: the Reserve Bank of India (banking), the Central Consumer Protection Authority (consumer rights and unfair trade practices), the Telecom Regulatory Authority of India (telecom) and the Securities and Exchange Board of India (securities market). Against hoarding and black-marketing, the government acted during COVID-19 by declaring sanitisers essential commodities under the Essential Commodities Act, 1955, capping the maximum retail price at ₹100 for 200 ml bottles, until new production made them widely available at fair prices. The government also provides public goods — roads, bridges, parks, street lighting, defence, sanitation and drainage — which private firms will not provide because they generate no direct profit, and which suffer the free-rider problem: everyone benefits whether or not they pay, so voluntary payment fails and public provision is needed.
What you should learn
After this chapter you should be able to: define demand and supply (willingness plus ability); state both laws and draw both curves; work the mango schedule and the ₹100/12 kg equilibrium example; distinguish movement along a curve from a shift of the curve, naming shifters for each; explain surplus and shortage and how prices adjust; argue why real-world equilibrium is always moving (masks, hotel tariffs); and explain government intervention — price ceilings, price floors, monopoly regulation, regulators, anti-hoarding action and public goods — with the sanitiser case as evidence.
Key Terms
- Demand — The quantity of a product people are willing and able to buy at a particular price.
- Law of demand — As price rises, quantity demanded falls; as price falls, quantity demanded rises (inverse relationship).
- Demand schedule / curve — A table / graph of prices and quantities demanded; the curve slopes downward.
- Supply — The quantity sellers are willing and able to offer at a particular price.
- Law of supply — As price rises, quantity supplied rises; as price falls, quantity supplied falls (direct relationship).
- Market equilibrium — The point where quantity demanded equals quantity supplied; neither shortage nor surplus.
- Shortage (excess demand) / surplus (excess supply) — Demand above supply at a price / supply above demand at a price.
- Price ceiling — An imposed maximum price a seller can charge (e.g. essential medicines).
- Price floor — An imposed minimum price (e.g. minimum wage); effective only above equilibrium.
- Monopoly — A market with a single seller of a unique product with no close substitutes, able to set prices and output.
- Hoarding / black-marketing — Accumulating goods beyond immediate need, often to profit from shortage / illegal trade in banned or regulated goods.
Remember
- Demand needs willingness AND ability (purchasing power) — desire alone is not demand.
- Demand curve slopes DOWN; supply curve slopes UP. Equilibrium is their crossing.
- Price change = movement ALONG the curve. Income, tastes, substitutes, technology, weather = SHIFT of the curve.
- Above equilibrium → surplus → price falls. Below equilibrium → shortage → price rises.
- Real equilibrium always moves: masks in 2020, hotel tariffs by season.
- Price ceiling = maximum (medicines). Price floor = minimum (wages). Do not swap them.
Exam Tip / Common Mistake
Common mistake: saying "demand increases when price falls" — no: when price falls, quantity demanded increases (movement along the curve); "demand increases" means the whole curve shifts right because of income, tastes or substitutes. Another slip: swapping ceiling and floor — remember, a ceiling caps prices from above (protects buyers), a floor supports prices from below (protects sellers/workers). In diagram questions, always label both axes (price, quantity), both curves (D, S) and the equilibrium point (E) — an unlabelled cross earns little.
Chart / Table: What shifts demand and supply?
| Curve | Shifts when… | Example |
|---|---|---|
| Demand | Income, tastes/trends, season, substitute/complement prices, expectations | Income rises → more demand; substitute dearer → demand for this good rises |
| Supply | Input costs, technology, weather, taxes/subsidies, other goods' profitability, expectations | Good weather → more crop supply; inputs dearer → supply falls |
| Neither (movement along) | Only the good's own price changes | Mango at ₹150 → 1 kg; at ₹50 → 3 kg |
Practice set — try it yourself
- What is demand, and why is desire alone not enough?
Hint: Willing plus able — purchasing power. - State the laws of demand and supply in one line each.
Hint: Inverse versus direct. - What happens if price is set above equilibrium?
Hint: More offered than wanted. - Name two things that shift demand and two that shift supply.
Hint: Income and tastes; weather and input costs. - What is a price ceiling, and who does it protect?
Hint: A maximum — think medicines.
Questions with Answers
- What factors influence the demand for a good?
Its own price (inverse relationship: higher price, lower quantity demanded), plus shifters: consumer income, tastes, trends and seasons, prices of substitutes and complements, and expectations about future prices. The mango example shows the price effect (₹150 → 1 kg, ₹100 → 2 kg, ₹50 → 3 kg); a rise in income or a festival season shows the shift effect, moving the whole demand curve. - How is the equilibrium price determined?
By the interaction of demand and supply: equilibrium is the price at which quantity demanded equals quantity supplied, so the market clears with neither shortage nor surplus. In the chapter's example, equilibrium is ₹100 with 12 kg. Above that price, surplus pushes the price down; below it, shortage pushes the price up — the market adjusts towards equilibrium. - Does market equilibrium exist in the real world?
Only as a moving target. In theory it is the crossing point of the curves, but real conditions — technology, wages, interest rates, wars, pandemics, weather, disasters — constantly shift both curves. The mask market in 2020 showed it: demand surged, prices spiked, supply adjusted, prices fell, and after the pandemic demand and prices fell again. Markets are always adjusting towards a new equilibrium, never resting at the old one. - How and why does the government intervene in markets?
Because markets allocate by ability to pay, they can leave essentials unaffordable and let monopolies exploit buyers. The government sets price ceilings (maximum prices for essentials like medicines) and price floors (minimum wages), regulates monopolies and unfair practices through bodies like the RBI, CCPA, TRAI and SEBI, acts against hoarding and black-marketing (sanitiser price cap of ₹100 for 200 ml under the Essential Commodities Act, 1955), and provides public goods (roads, parks, defence, sanitation) that private firms will not supply profitably. - Why do hotel tariffs change so much for the same room?
Because room demand changes while room supply is fixed in the short run. A Goa hotel with 100 rooms charges ₹1,500 on an off-season weekday, ₹8,000 on a tourist-season Saturday and ₹25,000 on New Year's Eve, and may cut tariffs 40% overnight if a booking cancels — responding to season, events, nearby hotels' tariffs, weather, booking pace and days left before arrival. It is dynamic pricing: the price follows demand and supply in real time.
Extension Questions with Answers
- Should price controls like the sanitiser cap stay forever?
Not necessarily. In an emergency, a cap stops exploitation when demand spikes and supply cannot catch up. But a permanent cap below equilibrium can discourage production and create shortages or black markets, since sellers earn less. The chapter's question invites judgment: controls are justified as temporary, targeted fairness measures, and should be reviewed as supply recovers — fairness today must not destroy supply tomorrow. - Why do our choices today affect future market equilibrium?
Because today's demand shapes tomorrow's supply: high demand for fast fashion, overfishing or groundwater overuse depletes the resources future supply depends on, shifting future supply curves left and raising future prices. Sustainable consumption — using less, wasting less, choosing durables — protects future equilibrium instead of borrowing from it. - What is the free-rider problem, and why does it justify public goods?
If a park is built, everyone nearby benefits whether or not they paid — so each family may reason, "others will pay, and I can use it anyway." Voluntary payment then fails and the park never gets built, even though all families want it. Government provision, funded by taxes, solves the free-rider problem for goods like parks, street lighting, roads and defence that are non-excludable and benefit all. - How would you explain the onion price swing to a friend?
Onions are seasonal and weather-sensitive: a poor harvest or damaged storage shifts supply left, so the same demand chases fewer onions and prices jump; a good harvest shifts supply right and prices fall. Add expectations (traders holding stocks for higher prices) and perishability (onions cannot wait for better prices), and small supply changes cause large price swings — the same mechanism as the mango season, in reverse. - Plot the chapter's three-price table (₹40, ₹100, ₹150) — what would you mark?
At ₹100 (equilibrium), mark the crossing: demand equals supply at 12 kg. At ₹150 (above equilibrium), mark excess supply — quantity supplied exceeds quantity demanded, a surplus that pushes price down. At ₹40 (below equilibrium), mark excess demand — quantity demanded exceeds quantity supplied, a shortage that pushes price up. The three marks together show why only the equilibrium price is stable, and why real markets keep moving as conditions change.
- Demand: willing + able; law = inverse; curve slopes down.
- Supply: willing + able to sell; law = direct; curve slopes up.
- Equilibrium: demand = supply; surplus above, shortage below; real equilibrium always moves.
- Shifts vs movements: price moves along; other factors shift the curve.
- Government: ceilings, floors, monopoly control, regulators, anti-hoarding, public goods.
How to use this page: Read the summary, say the Key Terms in your own words, then try the practice set without looking. Use the Questions with Answers to check yourself afterwards. Ask your teacher or parent to check your answers.