Chapter 14: Data Handling
Original notes — ready CBSE (NCERT, English Medium) • Class 4 • Mathematics • Book: Math Mela
Data Handling — EG's own notes, in simple words
Book: Math Mela (CBSE, Class 4) | Chapter 14 | Medium: English
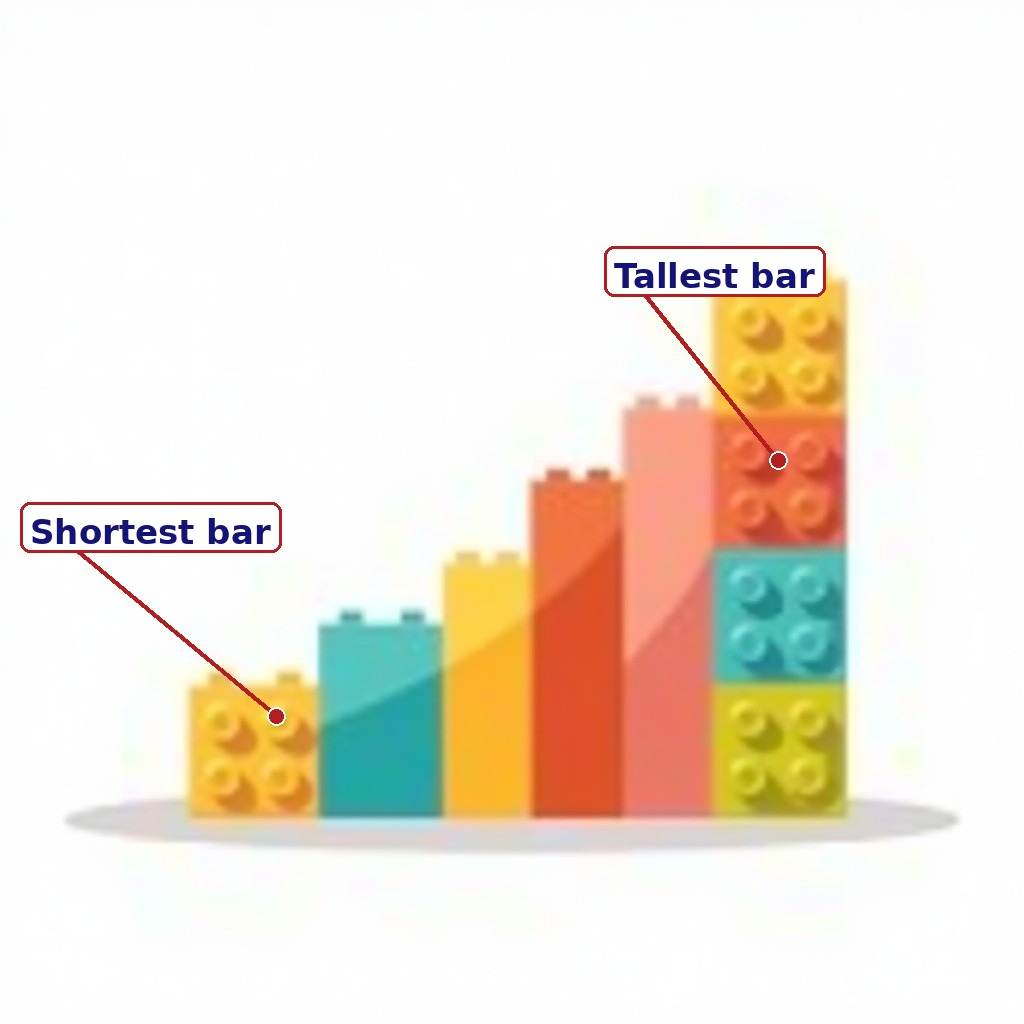
Diagram (labels are printed on the image): Colourful bars that rise from left to right like a bar chart. 'Shortest bar' points to the small yellow bar on the left and 'Tallest bar' to the tall stack on the right. Honest note: the bars carry no numbers and no labels, so no real values can be read off this picture — it shows only the idea that a taller bar means a bigger number. Real data with numbers is in the table in the text.
1. What is data?
Data is information we collect: how many children like apples, how many red cars pass the school, how many rainy days there were in June. On its own, a list of numbers is hard to read. Data handling means organising data so we can understand it quickly — with tally marks, tables and pictures.
2. Tally marks
Tally marks are a quick way to count. Draw one line for each item: | | | |. The fifth line crosses the first four: |||| — that bundle means 5. So 7 is one bundle of 5 plus 2 more lines. Worked example: 13 children like mangoes. In tally marks that is two bundles of 5 (10) plus 3 lines — 13 in all.
| Favourite fruit | Tally marks | Number of children |
|---|---|---|
| Mango | Two bundles of 5 + 3 lines | 13 |
| Banana | One bundle of 5 + 4 lines | 9 |
| Apple | One bundle of 5 + 1 line | 6 |
| Orange | One bundle of 5 + 2 lines | 7 |
3. Bar graphs and pictographs
A bar graph shows numbers as bars: a longer bar means a bigger number. A pictograph shows numbers as pictures: for example, one apple picture stands for 2 children, so 6 apple pictures mean 12 children. In our table above, mango is the favourite fruit (13 children) and apple is the least favourite (6 children). Reading a graph is just comparing bar lengths or counting pictures carefully — and always checking what one picture stands for.

New diagram: Fruit bars, shortest to tallest from left to right: apple (6 children), orange (7), banana (9) and mango (13, the favourite). The bars show the correct tallest-to-shortest order but are not drawn to exact scale, so do not read exact numbers off the picture — the table in the text gives the exact counts.
4. Asking questions from data
Good questions about data: Which is the most? Which is the least? How many more? How many in all? From our table: how many children chose mango and banana together? 13 + 9 = 22. How many more chose mango than apple? 13 − 6 = 7. Data answers real questions — that is why we collect it.

New picture: Children voting for their favourite fruit. Cheerful picture; it shows collecting data, not the mango, banana, apple and orange counts. The ballot box in the picture carries the word Vote.
Key Terms
- Data — Information collected, like counts of favourite fruits.
- Tally marks — Quick counting lines, bundled in groups of 5.
- Bar graph — A picture that shows numbers as bars; longer bar = bigger number.
- Pictograph — A picture that shows numbers using symbols, where one symbol stands for a fixed number.
Remember
- Tally marks are bundled in 5s: four lines, then one crossing line.
- In a bar graph, a longer bar means a bigger number.
- In a pictograph, always check what one picture stands for.
- Good data questions: most? least? how many more? how many in all?
Exam Tip / Common Mistake
Common mistake: counting pictograph pictures as 1 each without checking the key. If one picture stands for 2 children, 6 pictures mean 12 children, not 6. Read the key first, every time.
Practice set — try it yourself
- In a class, 18 children like cricket and 12 like football. How many more like cricket?
Hint: Hint: Subtract. - Draw tally marks for 17. How many bundles of 5 are there?
Hint: Hint: 17 = 5 + 5 + 5 + 2. - In a pictograph, one star stands for 4 children. 5 stars are shown for reading. How many children?
Hint: Hint: 5 × 4 = ? - A bar graph shows: red 10, blue 14, green 7. Which colour is most liked, and which least?
Hint: Hint: Compare bar lengths — longest = most. - Collect data: ask 10 friends their favourite colour. Make a tally table and say which colour won.
Hint: Hint: Count carefully, bundle tally marks in 5s.